Wind Bests Hydro as Installed Capacity Rises
David Wagman | March 06, 2017Iowa, South Dakota, Kansas, Oklahoma, and North Dakota all sourced more than 20% of their electricity generation from wind power during 2016, according to data from the U.S. Energy Information Administration (EIA) and reported by the American Wind Energy Association (AWEA).
The EIA data shows wind supplied more than 5.5% of electricity nationwide, up from 4.7% in 2015.
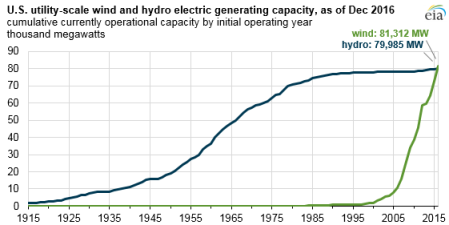
EIA also says that installed wind electric generating capacity in the United States surpassed conventional hydroelectric generating capacity, long the nation’s largest source of renewable electricity, after 8,727 megawatts (MW) of new wind capacity came online in 2016. However, given the hydro fleet’s higher average capacity factors and the above-normal precipitation on the West Coast so far in 2017, hydro generation will likely exceed wind generation in 2017.
 Installed wind generating capacity exceeded that for installed hydro in 2016, the Energy Department says.The wind energy industry invested more than $13.8 billion in new turbines in 2016, according to AWEA, in addition to operating a fleet now over 52,000 turbines.
In late February, for example, Vestas said it had received a firm order for 174 V110-2.0 MW turbines, totalling 348 MW. The contract includes supply and commissioning of the wind turbines, as well as a multi-year service agreement. Delivery is expected to begin in the first quarter of 2018, with commissioning expected in the fourth quarter of 2018. Wind turbine nacelles, blades, and towers will be produced in Vestas' Colorado factories.
Seasonal Patterns
Wind and hydro generation both follow strong seasonal patterns, EIA says. Hydro generation typically reaches its seasonal peak in the spring and early summer, especially in the Pacific Northwest and California where about half of U.S. hydropower is produced.
Across most of the country, wind generation typically peaks in the spring with a smaller peak in late fall and early winter. The Pacific Northwest and California have a slightly different seasonal pattern for wind resources, with generally one peak in the early summer.
Compared with other electricity generating sources such as nuclear, geothermal, and combined-cycle natural gas, hydro and wind have lower average capacity factors (that is, generation output as a percentage of total generating capacity). Both sources are sensitive to fluctuations in weather conditions such as droughts, heavy precipitation, and changes in regional wind patterns.
EIA says that given the hydro fleet's historically higher capacity factors compared with wind and the expected strong hydrological conditions on the West Coast this year, especially given the recent heavy rainfall in California and the Pacific Northwest, hydro generation in 2017 will likely be higher than wind generation even with anticipated continuing additions of new wind capacity throughout the year.
(Read "Highest Dam in the U.S. Faces Threat.")
Capacity Derate
For electricity reliability planning purposes, hydro and wind capacity are reduced (or derated) when estimating their expected contributions to meet projected peak-period electricity demand. Hydro capacity is generally derated to a lesser degree than wind capacity.
EIA’s data show that wind turbines operating in 40 states generated a record total of 226 million megawatt hours (MWh) during 2016. AWEA says that is around four times the amount of solar electricity production and approaches what hydroelectric dams generate in America.
In Oklahoma, wind’s share of total electricity generation grew from 18.4% in 2015 to 25.1% in 2016. In Iowa, wind grew from 31.5% to 36.6%, the highest in the nation. In Kansas, wind’s share increased from 24.1% to 29.6%. The Dakotas also saw significant gains, AWEA says, with South Dakota becoming the second state in the country to generate over 30% of its electricity from wind energy, and North Dakota rising to 21.5% wind.


