
View State-by-state Energy and Water Use Flow Charts
S. Himmelstein | April 20, 2018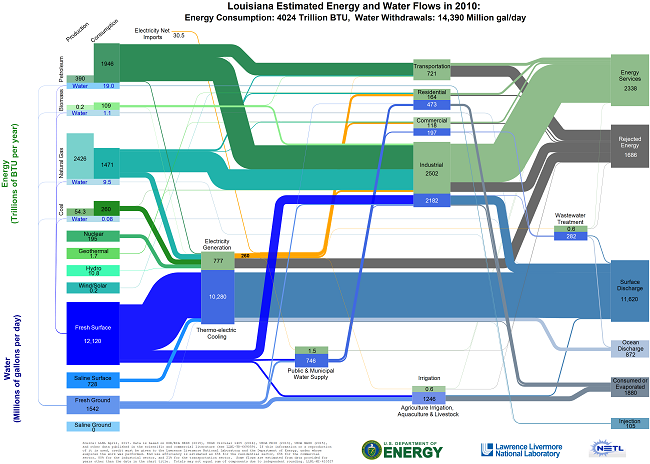 Chart for Louisiana shows that energy consumption totaled 4024 trillion BTU and water withdrawals totaled 14,390 million gallons/day in 2010. Source: LLNLState-by-state energy and water flow charts have been issued by U.S. Lawrence Livermore National Laboratory (LLNL) in one location so that analysts and policymakers can find all the information needed in one place.
LLNL worked with the U.S. Department of Energy (DOE) and the National Energy Technology Laboratory (NETL) to produce the atlas of hybrid energy/water Sankey diagrams for each of the states. These diagrams depict energy use and water flow during the year 2010, the latest year for which comprehensive data is available.
Sankey diagrams can be used to frame important discussions around energy and material resources, use and disposition and to support decision-making about public investment in innovation and energy-water policy.
There are several major interactions between energy and water supplies, infrastructures and disposition across the economy. The major uses of water in energy applications include: cooling of thermal power plants; hydropower; oil and natural gas extraction; coal production; biomass production; and fuel refining. The major uses of energy in water management include: water treatment and distribution; wastewater treatment including water recycling; agricultural water supply; and long-distance conveyance.




A very worthwhile effort. Some thoughts for a ten year update -
Use joules (or mega or giga joules) and cubic meters, not BTU's and gallons.
Provide gross values of amount of change over the ten year period, again in SI.
Provide for respective energy and water inputs and outputs, the ratios to a primary economic indicator for each state, such as state net product for each of the two annual data storms.
Try to talk others (China, EU, Japan) into doing the same thing.
All of this should spice up the academic life of the folks at Wharton, Sloan, etc., as well as the daily fare of the denizens of Langley, VA and those in the basements of Whitehall, UK.