Improving operational visibility through integrated power and process monitoring
May 15, 2026Modern industrial facilities and utility networks face increasing pressure to maintain uptime, improve energy efficiency and comply with evolving power quality standards. At the same time, electrical infrastructure is becoming more complex due to renewable integration, decentralized generation, high-speed automation systems and growing use of power electronics.
Traditional monitoring approaches are often no longer sufficient. Many facilities still rely on isolated power quality analyzers, SCADA systems or event recorders that operate independently from process monitoring systems. While these tools may identify that a disturbance occurred, they frequently lack the synchronized process context required to determine why it happened.
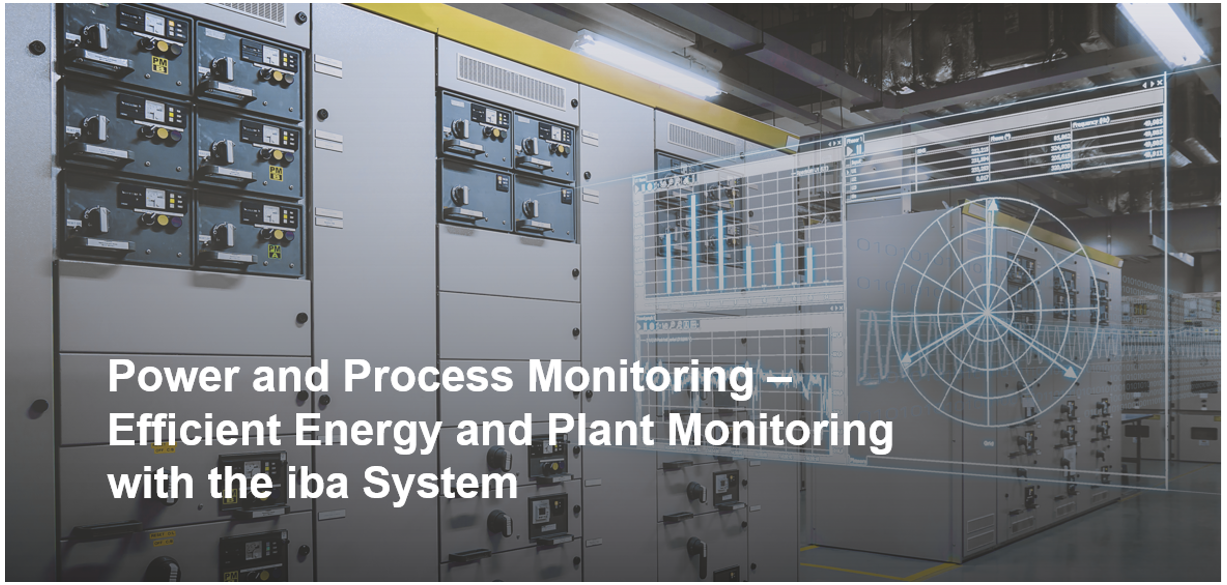 Figure 1: Power and process monitoring. Source: iba America
For plant engineers, utility engineers, reliability teams and energy managers, the challenge is no longer simply collecting electrical data. The challenge is correlating power quality events, protection system behavior and process conditions in real time to identify root causes quickly and prevent future disruptions.
Integrated power and process monitoring addresses this challenge by combining electrical measurements, process data, fault recording and event monitoring into a unified system.
The growing complexity of modern power systems
Industrial power systems have changed dramatically over the last decade. Facilities now operate with:
- Variable frequency drives
- High-power converters
- Renewable energy sources
- HVDC systems
- Energy storage systems
- Intelligent protection devices
- Distributed automation architectures
These technologies improve operational flexibility and efficiency, but they also introduce new electrical challenges such as harmonics, flicker, transient disturbances and voltage instability.
Distributed generation can also create fluctuations in power flow and grid stability. Energy producers and grid operators must continuously verify compliance with standards such as EN 50160 and IEC 61000-4-30 Class A to ensure supply quality and operational reliability.
At the same time, industrial consumers increasingly influence grid behavior themselves. Large drives, arc furnaces, converters and nonlinear loads can inject harmonics and disturbances back into the network. In many cases, operators must prove compliance with contractual power quality limits while also minimizing downtime and avoiding equipment damage.
This environment requires continuous monitoring with far greater visibility than conventional energy management systems can typically provide.
Why traditional monitoring systems fall short
Many conventional monitoring platforms aggregate electrical measurements into 10-minute or longer intervals. While suitable for reporting and billing applications, these aggregated values often miss the fast transient events responsible for equipment trips, process interruptions or protection system operations.
Traditional systems may answer questions such as:
- What was the average voltage?
- What was total energy consumption?
- Was a threshold exceeded?
However, they often cannot answer:
- What caused the event?
- Which device responded first?
- What process condition triggered the disturbance?
- How did the disturbance propagate through the system?
- Did the grid disturbance originate internally or externally?
Aggregated measurements alone are often insufficient for root cause analysis because they do not capture dynamic peak events or accurately identify when events occurred.
For reliability and maintenance teams, this gap can significantly increase troubleshooting time and delay corrective action.
Integrated monitoring systems overcome this limitation by combining synchronized electrical and process measurements with high-speed event recording.
Combining power quality and process monitoring
An integrated monitoring architecture enables operators to correlate power quality data directly with plant operating conditions and process behavior.
The iba system combines the following into a single synchronized platform:
- Power quality monitoring
- Energy monitoring
- IEC 61850 station monitoring
- High-speed transient fault recording
- Process data acquisition
This unified approach allows facilities to monitor not only what happened electrically, but also what the plant was doing at the exact moment of the disturbance.
 Figure 2: Power monitoring applications with the iba system. Source: iba America
One of the key advantages of integrated monitoring is synchronized acquisition. Electrical measurements, controller data, protection device events and process signals are all acquired with precise timing alignment.
This allows engineers to:
- Correlate process events with power disturbances
- Reconstruct fault sequences accurately
- Identify operational causes of harmonics or voltage dips
- Determine whether disturbances originated internally or externally
- Validate the effectiveness of mitigation measures
The ability to correlate process and electrical behavior becomes particularly important in facilities with dynamic loads such as:
- Steel mills
- Mining operations
- Chemical plants
- Renewable energy installations
- HVDC systems
- Large utility substations
Continuous power quality monitoring in real time
Power quality monitoring remains a critical component of grid reliability and operational stability.
The ibaPQU-S power quality unit continuously measures voltage and current values synchronized to the electrical grid while calculating power quality characteristics according to IEC 61000-4-30 Class A.
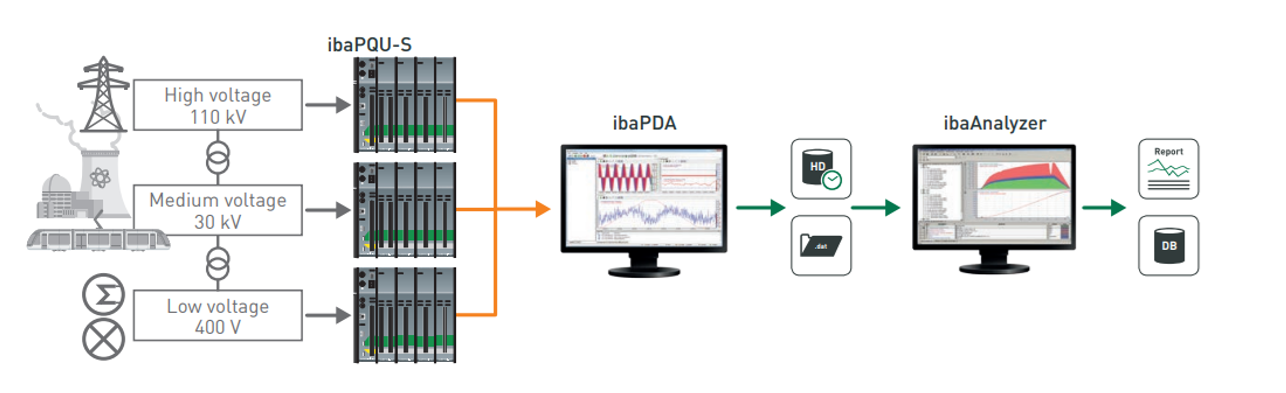 Figure 3: Example of power quality monitoring using ibaPQU-S. Source: iba America
Measured and calculated values include:
- RMS voltage and current
- Harmonics and interharmonics
- Total harmonic distortion (THD)
- Frequency
- Flicker
- Power factor
- Energy values
- Voltage dips and swells
- Phase relationships
Unlike traditional monitoring systems that primarily store aggregated values, the iba system also records high-resolution intermediate values and raw waveform data. This enables detailed analysis of dynamic events.
 Figure 4: Phasor and spectrum view. Source: iba America
 Figure 5: Flicker. Source: iba America
This higher-resolution visibility helps engineers identify issues such as:
- Harmonic distortion from power electronics
- Converter-related commutation notches
- Voltage dips caused by large motor starts
- Unbalanced phase loading
- Distorted current waveforms
- Flicker conditions
The system also supports measurements for specialized grids, including railway systems operating at 16.7 Hz.
Faster root cause analysis through event correlation
One of the greatest operational advantages of integrated monitoring is faster and more accurate root cause analysis.
The iba platform allows operators to analyze power quality events together with:
- PLC signals
- process conditions
- protection relay events
- IEC 61850 communications
- operator actions
- equipment states
Because all signals are synchronized, engineers can reconstruct event sequences with high precision.
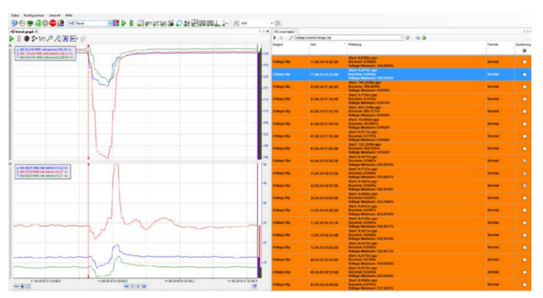 Figure 6: Voltage drop. Source: iba America
For example, if a voltage dip occurs:
- The system identifies the exact time of the disturbance
- Engineers can examine upstream and downstream electrical behavior
- Process states can be reviewed simultaneously
- Protection device actions can be correlated with the disturbance
- Trigger-based recordings can capture the event before and after occurrence
This capability significantly reduces troubleshooting time compared to isolated systems that require engineers to manually compare timestamps from multiple devices.
All calculated values and raw measurements can be used as trigger conditions for high-speed recording and fault analysis.
High-speed fault recording for critical infrastructure
Electrical faults and transient disturbances occur extremely quickly. In many cases, microsecond-level visibility is required to fully understand system behavior.
The iba system supports transient fault recording (TFR) with synchronized acquisition across multiple stations and distributed systems.
This enables:
- Trigger-driven fault recording
- Pre-event and post-event analysis
- Multi-station synchronization
- High-speed waveform acquisition
- Cross-station event reconstruction
The system can monitor thousands of signals simultaneously while recording disturbances with resolutions down to microseconds.
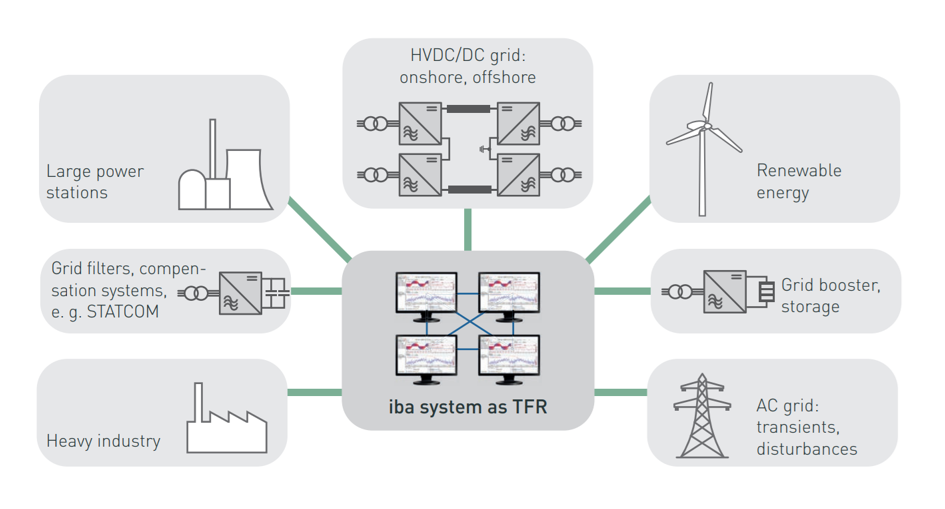 Figure 7: iba system as TFR. Source: iba America
This functionality is especially valuable for:
- HVDC systems
- Utility substations
- Renewable energy systems
- STATCOM and compensation systems
- Heavy industrial plants
- Large transmission networks
In complex systems spanning long distances, synchronized acquisition becomes critical. The iba multistation architecture allows multiple ibaPDA systems to operate as a single synchronized platform, enabling accurate fault reconstruction even across geographically distributed facilities.
IEC 61850 integration for utility applications
As utilities modernize substations and switchyards, IEC 61850 has become a central communication standard for protection and automation systems.
The iba platform supports:
- MMS communication
- GOOSE messaging
- Sampled values
- Comtrade file integration
- Time-synchronized event acquisition
This enables utilities to integrate intelligent electronic devices (IEDs), protection relays and process bus data directly into the monitoring environment.
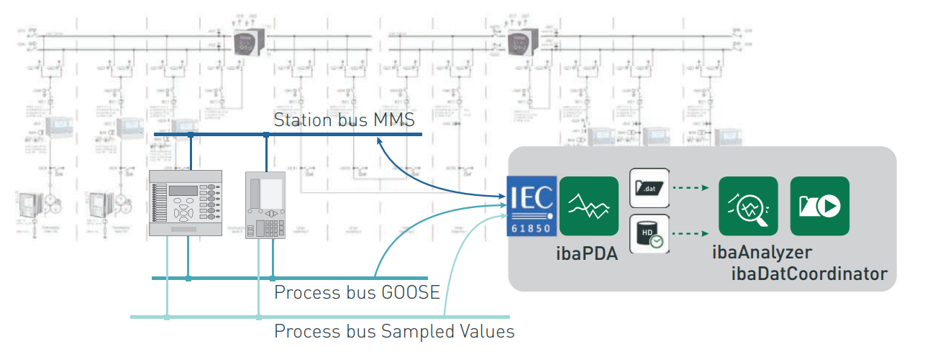 Figure 8: IEC 61850 station monitoring. Source: iba America
One significant advantage is the ability to acquire events together with the original device timestamps. This allows engineers to reconstruct protection sequences accurately and determine:
- Which protection device reacted first
- Whether protection coordination operated correctly
- How events propagated through the system
- Whether process behavior contributed to the disturbance
The platform also supports automated Comtrade file handling, reducing manual data collection efforts after fault events.
Real-world example: Steel plant power quality optimization
Integrated monitoring is particularly valuable in energy-intensive industrial environments.
One documented application involved a steel producer monitoring power quality parameters at transformer stations ranging from 110 kV to 30 kV in order to maintain compliance with EN 50160 standards.
By combining ibaPQU-S measurements with process and PLC data, engineers identified:
- Excessive harmonic levels
- Unbalanced phase loading
- Transformer workload issues
- System perturbations linked to process conditions
The synchronized monitoring approach allowed the facility to optimize transformer loading, reduce disturbances and improve operational stability. The system also enabled weekly reporting and long-term compliance documentation.
This type of application demonstrates how integrated monitoring can improve both electrical reliability and production performance simultaneously.
 Figure 9: Power quality monitoring and fault analysis in a steel mill. Source: iba America
Supporting the transition to decentralized energy networks
As decentralized energy systems continue to expand, integrated monitoring platforms will become increasingly important.
Siemens Energy relies on the iba system for centralized monitoring and analysis of decentralized energy networks, helping improve operational visibility, grid stability and overall system reliability, as described in the video “Stabilizing & Monitoring Decentralized Grids — Siemens Energy Relies on the iba System.”
The ability to collect, synchronize, analyze and visualize data from many different systems in one environment supports:
- Grid stability
- Faster diagnostics
- Better operational coordination
- Improved system availability
- Long-term reliability improvements
For facilities managing increasingly dynamic electrical environments, synchronized monitoring is no longer simply a diagnostic tool. It is becoming a core operational requirement.
Conclusion
Modern industrial and utility power systems require more than standalone meters and isolated event recorders. Engineers need synchronized visibility across electrical infrastructure, process systems and protection networks to maintain reliability and quickly identify disturbances.
Integrated power and process monitoring provides that visibility by combining the following into a unified platform:
- Continuous power quality analysis
- High-speed fault recording
- IEC 61850 station monitoring
- Process data acquisition
- Long-term trend analysis
- Centralized event correlation
By correlating electrical events with process behavior in real time, facilities can improve troubleshooting, reduce downtime, support compliance requirements and optimize overall grid performance.
Learn more
Watch how Siemens Energy uses the iba system to stabilize and monitor decentralized grids below.
For more information, visit the iba America website.