Video: Tour the universe with this interactive map
S. Himmelstein | November 24, 2022An interactive map charts the positions and colors of 200,000 galaxies stretching from Earth to the edge of the observable universe.
Thanks to researchers from Johns Hopkins University armed with data mined over two decades by the Sloan Digital Sky Survey, the map allows armchair astronomers to experience data previously only accessible to scientists. The Sloan Digital Sky Survey has been scanning the cosmos almost every night for over 20 years. The New Mexico-based telescope images different portions of the sky over time to build up a comprehensive atlas at different scales, including millions of stars in the Milky Way and galaxies billions of light-years away.
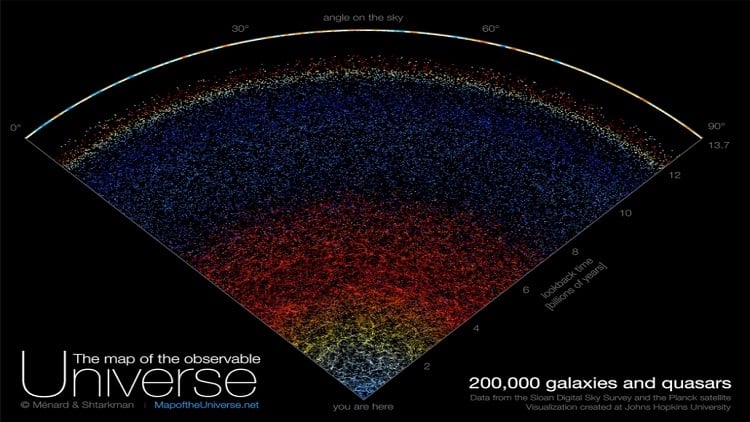 The map visualizes a slice of the universe, or about 200,000 galaxies; each dot on the map is a galaxy. Source: B. Ménard and N. Shtarkman/Johns Hopkins University
The Milky Way is a dot at the very bottom of the interactive map, while the top depicts the first flash of radiation emitted soon after the Big Bang, 13.7 billion years ago.