Color Meters and Appearance Instruments: Operation and Use
Engineering360 News Desk | January 05, 2016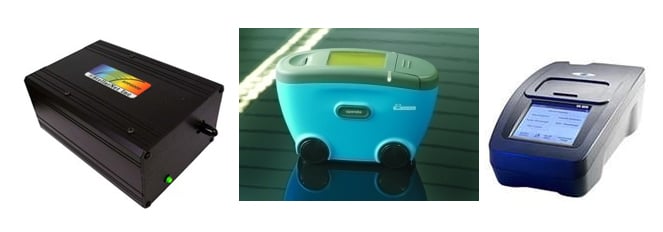 Colorimeter (left), Image credit: StellarNet. Inc; Coating Testing Instrument (middle), Image credit: Geneq Inc.; Portable Spectrophotometer (Right), Image credit: iis
Color measurement instruments are used primarily for determining the color characteristics of objects, imaging input and output devices.
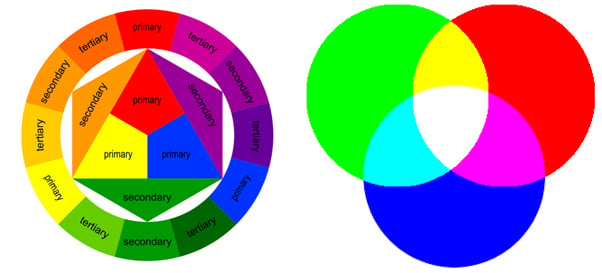 Color wheel (Left), Three primary colors (Right), Image credit: Jason Cohen
The perception of color is the result of interaction between a physical stimulus—receptors in the human eye that sense the stimulus; and the neural system and the brain, which communicate and interpret the signals sensed by the eye. The quantification of color belongs to the field of colorimetry. Colorimetry is essentially color matching experiments using three primary lights.
(Find color meters and appearance instruments by Specification or see the Engineering360 Directory of suppliers.)
The area has two main goals; to develop a method to summarize complex spectrophotometric curve (the fundamental photometric description of the light stimulus) as a trichromatic mixture of three primary colored lights; and using only primary color mixtures, predict whether two different lights or surfaces will visually match or appear to be the same color to a normal viewer. The spectrophotometric curve describes the relative quantity of light as a proportion of some standard or maximum quantity across the visible wavelengths.
Color vs. Appearance
In the field of colorimetry, there is a difference in the understanding of color and appearance.
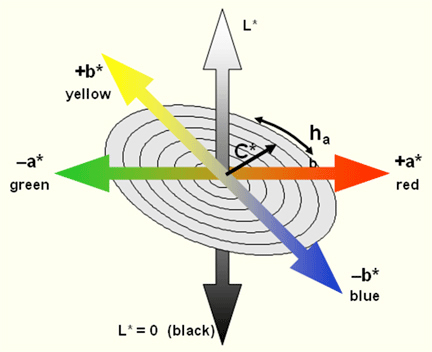
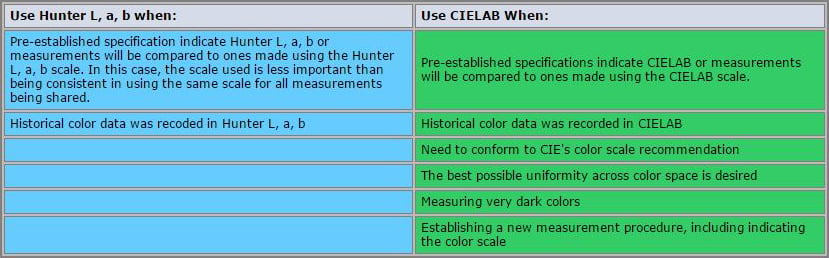
- Color is normally measured in terms of tristimulus values X, Y and Z. The values are manipulated mathematically to yield various color scales—the most common being Hunter, CIELAB, and CMC. The scales use three numbers represented as the letters L, a, b or L, C, H and use a three dimensional model with the mathematical difference represented as Delta E (ΔE).
- Appearance is the manifestation of the nature of objects and materials through visual attributes such as size, shape, chroma, color, texture, glossiness, haze, transparency, opacity, hue, luster, orange peel and translucency. These factors are all important in the visual uniformity of a product. Color is measured with a colorimeter, gloss with a gloss meter and texture is a catchall term. Gloss is usually measured with an instrument that measures the percent reflectance at 60 degrees, for example, a mirror would have a gloss of 100. There is no complete way to include these factors into a finish specification or to have a strong measurement for texture.
How Do Color Meters and Appearance Instruments Work?
Color Meters and Appearance Instruments use various scales to measure the perceivable colors.
There are six scales used to measure color and appearance.
- XYZ space allows colors to be expressed as a mixture of the three tristimulus values X, Y and Z. The term tristimulus comes from the fact that color perception results from the retina of the eye responding to three types of stimuli. After experimentation, the International Commission on Illumination (CIE) set up a hypothetical set of primaries, XYZ, that corresponds to the way the eye's retina behaves. Function Y is supposed to be the luminosity function, Z is (proportional to) the response of the short cones and X is more or less arbitrary concentration. Generally, color is described in this scale is given in two-dimensions because Y is often unspecified or irrelevant.
Sample data points:
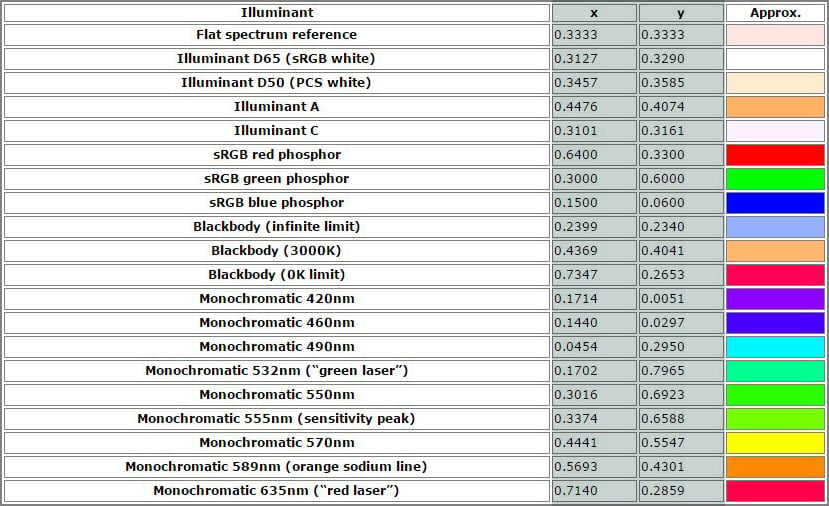
The XYZ scale can be used to measure the color of any object whose color can be measured, but it is not often used.
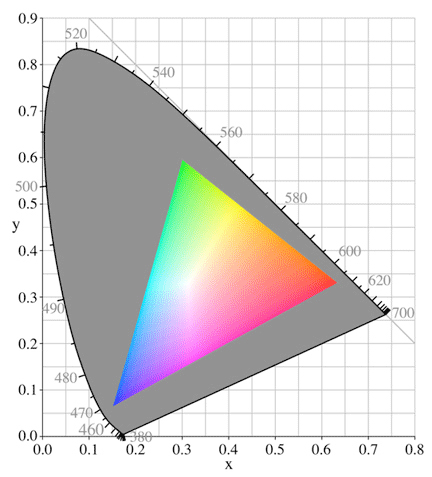
- Yxy CIE chromaticy coordinates specifies color by identifying the value (Y) and the color as viewed by the chromaticity diagram (x, y). Each of the tristimulus values combines information about chromaticy and luminance and is demonstrated by the chromaticity diagram. In the diagram, hue is represented at all points around the perimeter of the diagram, chroma is presented by a movement from the central white (neutral) area out toward the diagram perimeter, where 100% saturation equals pure hue. It does not correspond very well to the visual attributes of a color and was soon replaced by uniform color scales based on the opponent-colors theory.
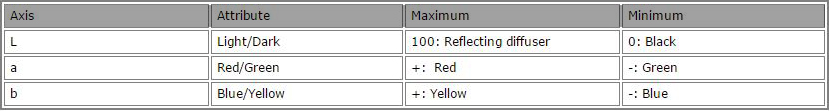
- Hunter L, a, b color scale is a three dimensional cube color space. It
 Chromaticy diagram. Image credit: gravurexchnage.comis more visually uniform than the XYZ color scale because the differences between points plotted in the color space correspond to visual difference between the colors plotted. The cube form allow the L axis to run from top to bottom, while a and b have positive and negative directions following the x and y axis.
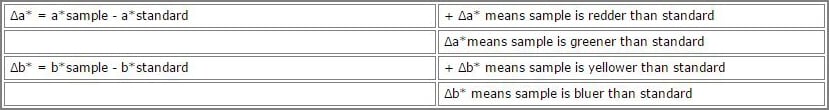
There are delta values associated with the Hunter color scale, which indicate how much a standard and sample differ from one another in each axis. Delta values are usually used for quality control or formula adjustment and a tolerance is set. For example, if the Δb value is out of tolerance, the blueness/yellowness needs to be adjusted, and if the value is positive, the sample is yellower than the standard. The total color difference, ΔE, is a single value that takes into account the difference between the L, a and b of the sample and standard. Delta E is misleading because it does not indicate which sample is out of tolerance. Most of these problems, including effects of the light-dark scale, have been accounted for in new machines.
The formulas associated with the Hunter L, a, b color scale are:
L= 100√Y/Yn
a = Ka [((X/Xn)-(Y/Yn))/ (√Y/Yn) ]
b = Kb[((X/Xn)-(Y/Yn))/(√Y/Yn)]
Where,
X, Y and Z are the CIE tristimulus values
Xn, Yn and Zn are the tristimulus values for the illuminant
Yn is 100.00
Xn and Zn are listed in the table below
Ka and Kb are chromaticity coefficients for the illuminant and are listed in the tables below.
CIE 2 Degree Standard Observer
The Hunter Color Scale can be used to measure any object whose color can be measured.
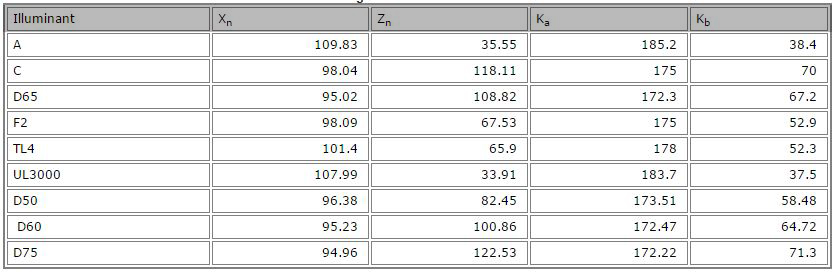
- CIELAB Color Scale is an approximate uniform color scale where the differences between points plotted in the color space correspond to visual differences between the colors plotted. CIELAB is organized in the same cube form as Hunter L, a, b and have associated delta values, which indicate if the parameters are out of tolerance. There are two other delta values related to this scale. The ΔC* is the difference in chroma between the sample and standard as described in a polar coordinate system. The ΔH* is the difference in hue angle between the sample and standard as described in polar coordinate system.
 CIELAB color scale. Image credit: gravurexchange.com
CIELAB formula comprises four transformation steps, which are intuitive when examined separately. The formulas associated with CIELAB are:
If X/Xn, Y/Yn, and Z/Zn are all greater than 0.008856, then
L* = 116 3√(Y/Yn)-16
a* = 500 3√(X/Xn) - 3√(Y/Yn)
b* = 200 3√(Y/Yn) - 3√(Z/Zn)
If X/Xn, Y/Yn, and Z/Zn is equal to or less than 0.008856, then
L* = 903.3 (Y/Yn)
a* = 500 [f (X/Xn) - f (Y/Yn)]
b* = 200 [f (Y/Yn) - f (Z/Zn)]
Where,
X, Y and Z are the CIE tristimulus values
Xn, Yn and Zn are the tristimulus values for the illuminant
Yn is 100.00
Xn and Yn are listed in the table above.
ΔE*= √ΔL*2+Δa*2+Δb*2
ΔC*= C*sample - C*standard
Where,
ΔC*= √a*2 + b*2
ΔH*= √ΔE*2+ΔL*2+ΔC*2
This scale can be used on any object whose color can be measured.
- CIELCH color scale is a color standard developed from CIELAB. CIE L*, C*, h are polar representation of the CIE L*, a*, b* rectangular coordinate system. It describes color in the same way that it is verbally communicated in terms of lightness, L*, chroma, C* and hue, h. CIELCH uses a color wheel to measure color. L* is the lightness coordinate, which is perpendicular to the plane of the diagram. C8 is the chroma coordinate, the distance from the center that describes how saturated the color is. The position around the wheel is the hue angle that is expressed in degrees, with 0° for red, 90° for yellow, 180° for green and 270° for blue. This scale is not as easy to understand as CIE L, a, b, but it is easy to relate to earlier systems based on physical samples. It is useful when attempting to visualize issues relating to device gamuts (color capabilities).
- ΔE*CMC color scale stands for Color Measurement Committee of Dyers and Colorist. It is a single pass/fail measurement that defines a three-dimensional tolerance space. dECMC is an adaption of the LCH equations and is used in the textile industry. Color differences calculated using the CMC scale are believed to correlate better with visual assessment than color difference calculated using other instrumental systems. The equations are based on an ellipsoidal space. It is more difficult to use than CIELAB because the ratio between lightness and chroma (l: c) can be weighed. The chroma is usually smaller than the lightness because humans perceive smaller shifts in chroma than in lightness. Typical l: c ratio is 2:1 for more applications. This ratio affects the shape of the ellipsoid.
ΔE*CMC= √[(L*2-L1*)/lSL]2 + [(C*2-C1*)/cSC]2 + [(ΔH*)/SH]2
SL= {0.511 SC = [(0.0638C1*)/(1 + 0.0131C1*)] + 0.638 SH = SC (FT +1 - F)
0.040975L1* L1* < 16
1 + 0.01765L1* L1* > 16
F = √ (C1*4)/( C1*4 + 1900) T = { 0.56 + |0.2 cos(h1 + 168°) 2 |164° < h1 < 345°
0.36 + |0.4 cos(h1 + 35°)| otherwise
Product Selection
The GlobalSpec SpecSearch database allows industrial buyers to select color meters and appearance instruments by type, configuration criteria, performance specifications and features.
Product Type
There are four types of color measuring machines. Each device has a different mechanism to measure the color of an object and works best in a specific application. The devices are described below.
- Colorimeters measure color using three or four filters that match human color receptors. The device uses a light source to light the specimen
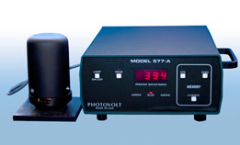 Colorimeter. Image credit: photovolt inc. being measured. The light reflected off the object then passes through a red, green and blue glass filter to simulate the standard observer functions for a particular illuminant. It determines the color based on how much of each color light is absorbed by and reflected off the object—the more a colored light is absorbed, the less it is reflected. Colorimeters can show L, a, b or L*, a*, b* numbers but can only measure in one light source.
- Applications - analyze the color contrast and brightness on screens, color management systems for the printing industry and measure the optical properties of precious stones, medical/dermatological applications.
 Densitometer. Image credit: printinternationalDensitometers measure the optical density of ink films using one or more filters. Some devices use a transmission technique, in which light is transmitted through the substance being measured, and a photoelectric cell reads the light as it passes through. The density is measured by observing how much light made it through the object. For solid objects, the amount of light reflected off is measured. Densitometers do not give complete color information, but are useful for specification and control of printed colors.
- Applications - used by photographers and printers to check saturation, quality and standardization in work. Measuring bone density.
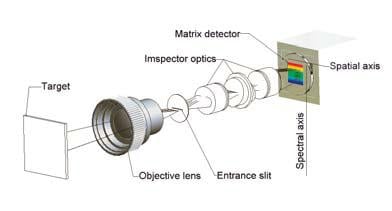
- Spectral Cameras provide measurements with full spectral and spatial information. They are used to acquire the hyper spectral target image at tens or hundreds of wavelengths simultaneously. Spectral imaging is a technique that provides information about the object beyond what an observer can see in the visible spectrum. A simple configuration contains a black-and-white camera to capture the gray scale view of an
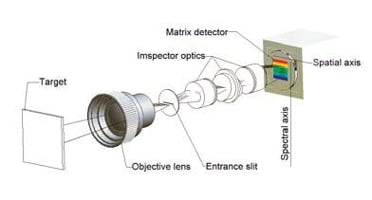 Spectral camera. Image credit: Gilden Photonicsobject, a color camera with three image sensors to deliver a multispectral image with three color channels (red, green, blue) and a mechanism to capture the image.
- Applications - scientific research, medical practices, military theory, artwork analysis.
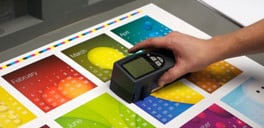
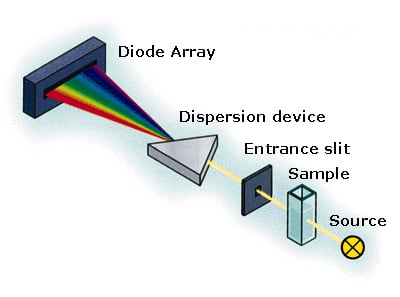
- Spectrophotometers operate on the principle of reflected light. They measure individual wavelengths and then calculate L, a, b or L*, a*, b* values from this information. They can measure in all standard illuminants. The basic components of a spectrophotometer are an illumination source, interference filters powered by stepper motor, detector or photodiode and readout device. White light is used as the illumination source because it contains all the colors of the visible spectrum. The object being analyzed (or matched in the case of paint chips) is placed in front of the source and flooded with white light. The light is reflected from the object and back into the machine and onto a small wheel. The wheel is a highly efficient color analyzer and consists of a number of interference filters. Each filter is programmed to allow a specific wavelength of light to pass through it and in modern machines. Only the color of the sample reaches the filters while other wavelengths are reflected away. This increases the accuracy of the match. As the light wave passes through the sample, it reaches a photo diode that converts the information to an electronic signal to be sent and to a computer. The computer identifies the exact pigments that will match the sample object.
- Applications - paint chip matching, biological and chemical research, textile and ink manufacturing.
 Spectrophotometer. Image credit: New Mexico State UniversitySpectrophotometers are different from colorimeters because they measure the intensity of any wavelength of visible light while colorimeters only measure red, green, and blue colors of light. Both rely on Beer-Lambert's law to calculate the concentration of a substance in a solution. Colorimeters are less complicated and more rugged devices than spectrophotometers.
Color of an object is an aspect of object appearance distinct from form, shape, size, position, or gloss that depends upon the spectral composition of the incident light, the spectral reflectance of transmittance of the object and the spectral response of the observer, as well as the illuminating and viewing geometry.
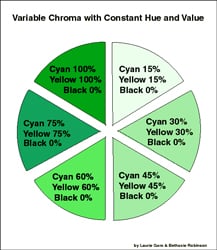
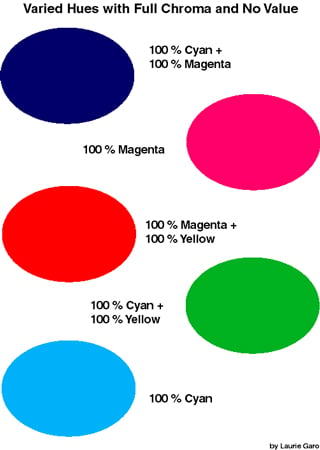
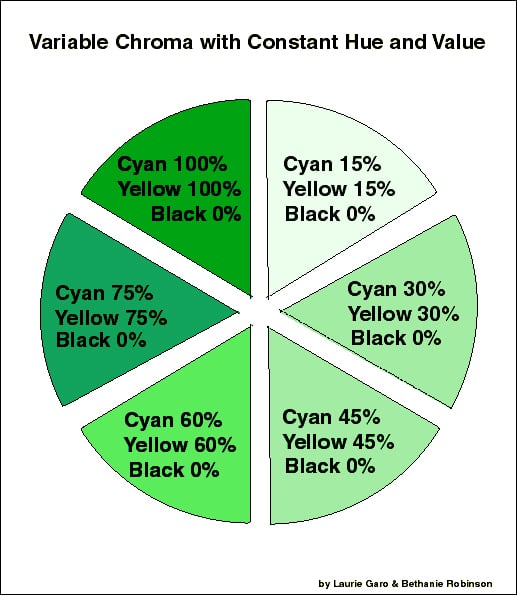
- Chroma is the attribute of color also known as intensity, saturation or purity of a color. It is the degree of departure of the color from a gray of the same lightness and is measured from 0% (neutral gray) to 100% (maximum saturation or Chroma).
- Gloss is the angular selectivity of reflectance, involving surface reflected light. It is
 responsible for the degree to which reflected highlights or images of objects may be seen as superimposed on a surface.
- Haze is the scattering of light at the glossy surface of a specimen responsible for the apparent reduction in contrast of objects viewed by reflection at the surface.
- Hue is the attribute of color by means of which a color is perceived to be red, yellow, green, blue and purple. Pure white, black, and grays possess no hue.
- Luster is the appearance characteristic of a surface that reflects more in some directions than it does in other directions, but not of such high gloss as to form clear mirror images.
- Orange peel describes an uneven surface, somewhat resembling that of an orange peel. It is a measure of surface waviness.
 Translucency is the property of a specimen by which it transmits light diffusely without permitting a clear view of objects beyond the specimen and not in contact with it.
- Transparency is the degree of regular transmission, thus the property of a material by which objects may be seen clearly through a sheet of it.
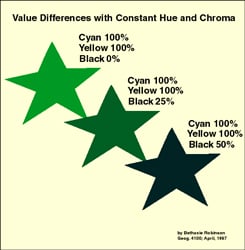
- Value describes the lightness or darkness of a hue or chromatic color. It is higher (lighter) when there is more lightness and lower (darker) when the hue appears darker. Value can be affected by background and is controlled by adding white or black pigments. The following apply to hues of differing value:
- Tint: add White to a hue, e.g., Pink is a Tint of Red
- Shade: add Black to a hue, e.g., Dark Red is a Shade of Red
- Tone: add equal amounts of a Hue, White and Black


Performance Specifications
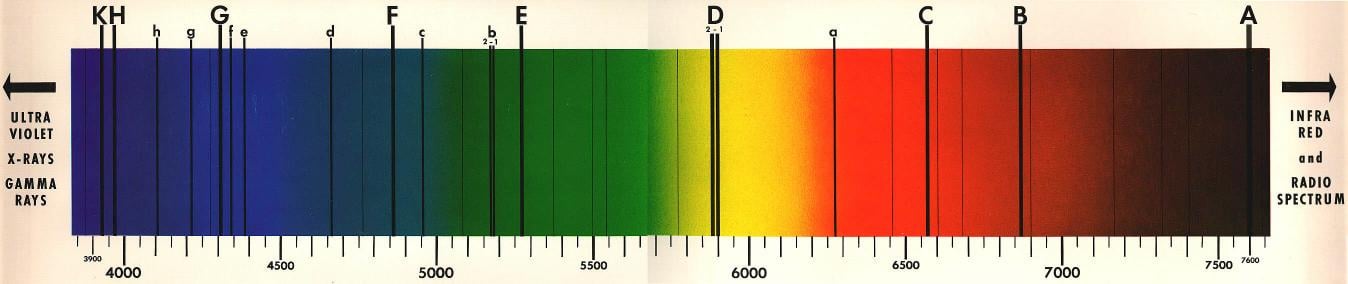
- Spectral Range describes the range of wavelengths the instrument can measure. Each color in the visible spectrum has a unique wavelength, with infrared and ultraviolet appearing outside of the visible range.
- Resolution is the smallest wavelength the instrument can distinguish.
Features
Features are available on many models of color meters and appearance instruments. These features include:
- Pass/Fail mode allows for rapid sampling.
- On-board statistical capabilities allow multiple measurements of a large sample to be quickly averaged.
- Portable instruments can be used for field or commercial work since they are not fixed in place and are light enough to carry.
- Ruggedness means that instrument can operate in high temperature or high humidity environments
- Computer interfaces allow for the instrument to be controlled or monitored remotely with a computer, via an interface.
- Application Software included for sample analysis.
 Spectral range. Image credit: galaxyzooforum.org
Standards
Commission Internationale de l'Eclairage (International Commission on Illumination, CIE) is the primary organization responsible for standarization of color metrics and terminology.