Mapping since Mercator
Amy J. Born | January 30, 2019Maps, once staples of elementary school classrooms and automobile glove compartments, have practically become anachronistic in the age of talking GPS. Nevertheless, their usefulness has hardly diminished.
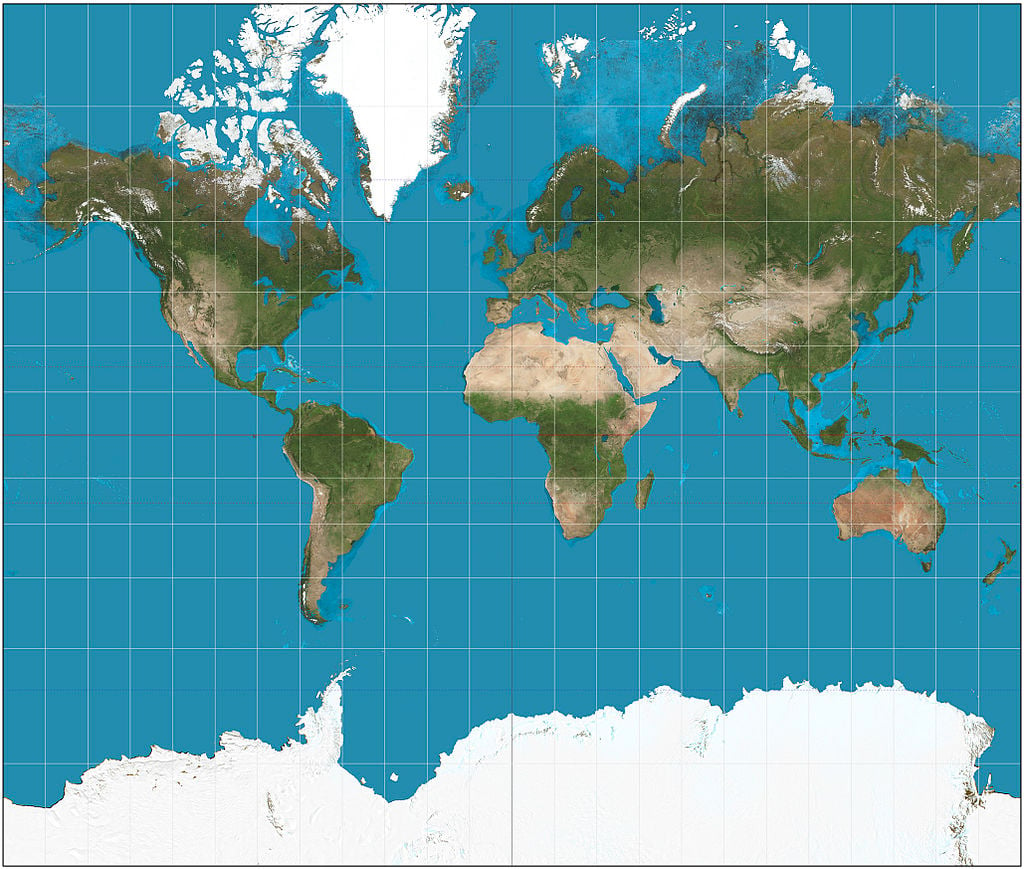 Mercator map projection. Source: Strebe/CC BY-SA 3.0Maps are not only essential for navigation, but they also teach us about the world and shape our perceptions. They show where places are in relation to each other and in relation to us. Maps identify geographical attributes that influence cultures like mountains, deserts, rivers, oceans and roads. They are handy tools for visually conveying all sorts of social, political and economic information such as details about population, climate, income, resources, agriculture, industry and trade.
Most people are familiar with the Mercator projection, developed by Gerardus Mercator 450 years ago in 1569, by sight if not by name. The term “projection” refers to a flat representation of features from a curved surface, such as Earth. The Mercator projection has been, and arguably remains, the most widely used map projection, although it has its problems.
Mercator issues
Mercator’s goal was to create a map that allowed European sailors to chart courses of constant bearing across oceans. He did this by drawing straight lines of longitude and latitude. Unlike the curved lines on a globe that meet at the poles, the parallels and meridians on Mercator's map are at constant right angles. This works well for ocean navigation purposes but distorts sections of the map. Areas around the equator are essentially accurate, but as one moves closer to the poles, the distortion increases, creating a false perception of the relative size of countries and continents.
For example, Greenland appears roughly the size of Africa when it is, in fact, approximately one-third the size of Australia. Alaska appears significantly larger than Mexico when it is actually about 95,000 square miles smaller. (Google Maps uses a variant of the Mercator projection, but because the app is generally used for such small areas the distortion is not noticeable.)
Because the Mercator projection shows global powers such as the United States and Europe as larger than they are some, people feel that over time the Mercator projection has fostered a sense of Western dominance.
Try Googling “What’s wrong with Mercator?” for more on this, or watch an accurate explanation by a fictional organization in an episode of the TV drama “The West Wing” here. To see for yourself, visit thetruesize.com to accurately see the relative sizes of countries and continents compared to how they appear in the Mercator projection.
Many different map projections have been created over the centuries; however, the conversion from a three-dimensional globe to a two-dimensional map always introduces some distortion. The Gall-Peters projection was adopted by Boston public schools in 2017 because it shows the relative size of countries and continents more accurately than Mercator, but it distorts shapes, distances and angles.
Navigation in the 21st century
Current navigation technology continues to expand the amount and nature of available information. The convenience of digital navigation in our cars, which not only tells us how to get places but also finds places for us to go, is only the beginning. Satellite technology is transforming the global container shipping industry, which accounted for 60% of all world trade and $12 trillion in goods in 2017.
Navigation tools for crossing oceans have come a long way since Mercator. Over the past 15 years, even large ocean-going ships have switched to paperless navigation. The Electronic Chart Display and Information System (ECDIS) offers many advantages over paper, including timely availability of charts, accuracy and ease of use for planning passage and making corrections, continual monitoring of the vessel’s position and anti-grounding alarms.
Other examples include AIS (Automatic Identification System), a broadcast system used by ships and onshore vessel traffic services to identify, locate and track vessels. LRIT (Long Range Identification and Tracking) is a reporting system that enhances maritime safety and security, and protects the marine environment.
 In a 2016 Bloomberg interview, exactEarth CEO Peter Mabson explained that his company uses Satellite AIS (S-AIS) to track every commercial vessel (150,000 each day) anywhere on the planet, including on rivers and lakes and in the Arctic. A network of satellites uses each ship’s location signal to gather information. Computer algorithms process the huge amounts of collected data. Information such as fuel efficiency and expected arrival time, as well as the vessel’s history and activity, is provided via a software platform and updated every 60 seconds or less. Customs authorities and port personnel can receive up-to-the-minute data on when a ship will arrive in port and whether it will be able to unload based on current port traffic.
Mabson valued the maritime information market at about $800 million because of the cost savings associated with greater efficiency (“[Shipping companies] spend several billion dollars on fuel alone,” he said.). The information provided by exactEarth is also used in search and rescue, national defense, financial markets and to curtail illegal fishing. The technology can even identify ships that use GPS to spoof their locations.
Lastly, Mabson acknowledged that S-AIS is moving the industry toward smart shipping and e-navigation (autonomous vessels). “Where we’re headed to realistically in the next few decades is to have both human and automated systems working together.”
In a nod to the potential perils of computer-based navigation systems, the U.S. Naval Academy in 2015 reincorporated three hours of lessons on celestial navigation into the advanced navigation class required for all 2nd class midshipmen. The classes are intended to help protect warships and sailors if computers fail as a result of cyber attack or other malfunction.


Interesting corollary: Cartographer comes in first on this list of top engineering jobs for 2019.