Forecasting US water supply trends
S. Himmelstein | May 28, 2026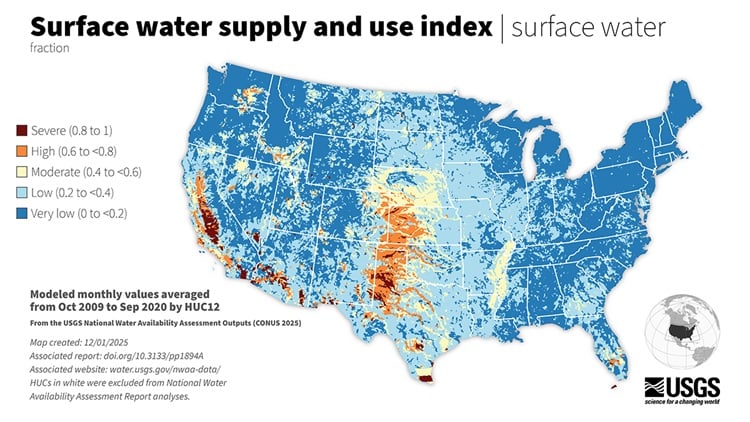 Source: USGS
According to the U.S. Geological Survey (USGS), more than 224 billion gallons of freshwater are withdrawn daily in the contiguous U.S. for crop irrigation, municipal water supply and thermoelectric power generation. A new tool has been developed by the agency to help water planners determine if communities have enough water for these current and future needs.
The National Water Availability Assessment Data Companion provides detailed information about water supply and demand across approximately 80,000 watersheds nationwide. The online tool is based on USGS models that integrate monitoring data, satellite observations and climate information. Users can access up to 40 years of monthly water supply information, including streamflow, snowpack and soil moisture data. Data comparing supply and demand are available from 2009 to 2020. Public supply, crop irrigation and water supply data extend from 2000 to 2020.
Regional patterns in water availability are evident in the data base. For instance, the Mississippi Embayment receives the nation’s fourth-highest natural water supply from rainfall and river flows. However, in 42% of the area, intensive crop irrigation for rice and cotton drives water demand to levels that approach or exceed natural supply. The Central and Southern High Plains region faces challenges from both limited precipitation and substantial irrigation demand for corn, soybean and cotton crops.
Users can explore conditions for any watershed, compare regions, identify seasonal patterns and download complete datasets in multiple formats for custom analysis.