Good Engineer or Good Project Manager? Cost Considerations
Peter G. Hessler | May 05, 2016An earlier article discussed the need for the plant engineer-as-project manager to be able to step back from the details to see the overall picture with an eye toward predicting the accuracy of the contractor’s project completion estimates. In this article, we focus on cost issues.
While project completion per plan is important for knowing when revenue generation can start or re-start, project cost assessment is an important tool for gauging return on investment. In other words, have adequate funds been allocated to complete the work or will additional funds be required that may no longer make the project viable?
Project on Schedule?
Let’s go back to the original example of a chemical plant with five miles of piping and a 20-month-long project plan. That earlier discussion centered on what metric best represented the actual status of completion.
 The fact that 2 miles of piping had been completed seemed to verify that everything was per the contractor’s reporting status. Image source: Wikipedia First, was the suggestion that elapsed time could be compared to total time. In that case, 8 months out of the 20-month schedule suggested the project was 40% complete, just as the contractor was reporting. A second metric was to consider expended man hours, or work effort, compared to total man hours budgeted for the work. Here, 40,000 of the planned 100,000 man hours had been expended, also suggesting that the 40% complete number was reasonable. And third, the fact that 2 miles of the total 5 miles of piping had been completed seemed to verify that everything was per the contractor’s reporting status. But that, too, proved to be less than accurate.
Indeed, when managing complex projects, one must be able to “feel” the work going on in light of the work that remains to be done. In that way, the project manager knew that time expended, or even man hours expended and piping installed, did not guarantee that the job was 40% complete. In this case, the more accurate measure was to gauge work effort by the welding of pipe joints; we saw that this was below the 40% point and could potentially lead to the job not completing on time.
But in addition to the potential for the completion date not being met, the original estimate of 100,000 man hours could be exceeded. Here is where the project manager must delve into the cost implications because man hours are directly representative of the project’s cost.
Will the Project Meet Budget?
So far, the project manager knows that 40,000 man hours have been expended. He or she also knows that the job completion is less than 40% based on weld count completion. What is now needed is to know A) the actual percent complete and B) how many man hours will be required to reach the 100% point of completion. Armed with this additional data, the project manager will be able to project the final costs and determine whether additional funding will be required.
As a start, the actual percent complete must be determined. In its most simplified form, one needs to determine how much effort will be required to complete the remaining work, add that to what has already been expended, and then derive a ratio of the two. During a re-estimate, it turns out that an additional 80,000 man hours will be required to complete the work. Adding this to the already-expended 40,000 man hours results in a revised project budget of 120,000 man hours. This puts the project at only 33% complete.
The method used to arrive at the above 80,000 man hour number is simply an exercise in productivity measurement. One knows how many welds were made during the 40,000-manhour expenditure. Assuming the level of difficulty remains the same for the rest of the project, then a calculation can be made of how many more man hours will be required to complete the project while the remaining welds are being completed. A graph comparing the man hours expended with the newly projected man hours against the percent complete expended and projected shows the story.
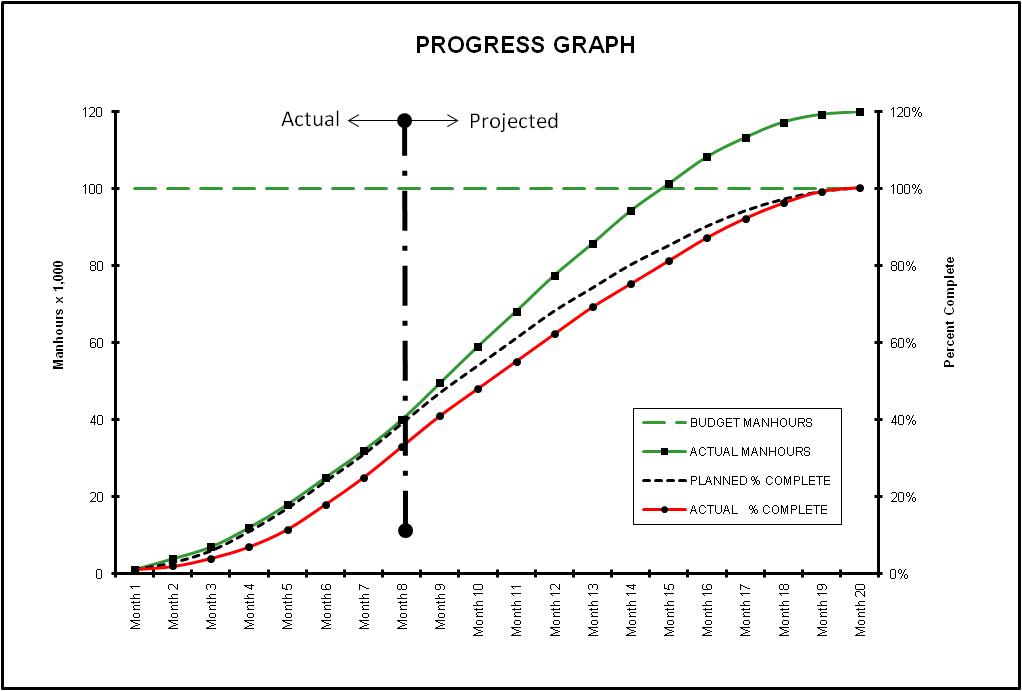 (Click to enlarge.) The original planned percent complete and the actual percent complete are not in synch, suggesting the project may be in trouble. Author’s construct. What can be seen is that the job is both behind schedule and over on man hours which equates to a cost overrun. Looking closely at month 8, the graph shows that the original planned percent complete and the actual percent complete (shown against the right-hand axis) are not in sync; the actual percent complete is behind the planned percent complete and the job is behind schedule. (Note that the planned percent complete is derived from industry-standard S-curves for this type of work.)
What is also apparent in month 8 is that the man hours expended (shown against the left-hand axis at 40,000) are above the actual percent complete curve. This suggests that more effort is being expended than value achieved; that is, the job is in a cost overrun position in addition to being behind schedule. Interestingly, this could be seen from the very beginning of the job.
By projecting the man hours required to complete the remainder of the project (the 80,000 man hours noted above) the project manager now can see that barring any change to the current work method, this project will run over costs by 20%. As shown on the graph, the project will still meet the scheduled 20 months for completion. However, this requires several assumptions to hold true: A) maintaining productivity, and B) having additional manpower available (or using overtime) to accomplish the additional 20,000 man hours of work for the remaining 12 months.
Pillars of Construction
The four pillars of a construction project are cost, schedule, safety and quality. Because projects of this type typically are more time than cost sensitive, the graph was developed assuming that the original schedule would be maintained, or “forced” into compliance. But as can be seen from the graph, there is a cost for this. In this case, that cost is an additional 20,000 man hours using more workers and/or overtime.
Had the project engineer/project manager not seen the correlation between the work effort (man hours) and planned-versus-actual percent complete, the potential cost overrun would not have been discovered until the project was nearly complete. At the 8-months point, as shown in this example, there still may be time to change work methods, such as using orbital welding, to reduce the potential cost increase.
Author: Peter Hessler, a former practicing engineer, is president of Construction Business Associates, LLC (email:pghessler@constrbiz.com), a provider of business-management services to the power and process construction community. He has 40 years of experience in the power and industrial plant construction and maintenance industry worldwide, having worked as an owner, contractor and now as a consultant. He has a B.S. in Mechanical Engineering from Virginia Polytechnic Institute, and is the author of two books on power-plant construction management. For a more in-depth discussion on managing large and complex industrial projects, please contact him, or read his book, Power Plant Construction Management: A Survival Guide, an overview of which can be seen here.